
A team has started using a research assistant, and a manager wants to know whether the work is helping. One decision turned out well after a weak explanation. Another followed a careful process and met an unfavorable outcome. Which result should guide the next investment?
A system can also collect excellent sources, produce accurate summaries, and leave someone with the same decision they would have made without it. The work may still save effort or clarify a choice. Those benefits need an evaluation that can actually observe them.
Evaluation starts by separating the units of learning. A source retrieval, an answered question, a probabilistic forecast, and a chosen action have different acceptance criteria. Treating them as one generic quality score obscures both failures and opportunities to improve the product.
A practical measurement design can connect those units while preserving their differences.
Decide what the product is claiming to improve
Research completeness asks whether the necessary evidence was obtained and the question was addressed. Predictive evaluation asks how issued expectations compare with resolved outcomes. Calibration asks whether stated probabilities correspond to observed frequencies in the relevant setting. Decision evaluation adds the available actions, constraints, and consequences.
A causal claim goes further: the research feature changed an outcome compared with what would have happened without it. A before-and-after chart or a successful decision does not isolate that effect on its own.
These distinctions should shape the product's records. A retrieval receipt supports an account of which sources arrived. An evidence review supports an account of whether a conclusion is grounded. A prospective forecast supports scoring after its target resolves. A decision journal helps explain how a person acted under the information and constraints available.
A team can measure useful progress at each level without pretending that a lower-level result establishes a higher-level benefit.
Freeze the target before its outcome is known
A forecast needs a proposition specific enough to resolve. Identify the event or quantity, the horizon, the resolution source, the treatment of revisions, and the time at which the expectation was issued.
“Conditions will improve” leaves too much room for reinterpretation. A defined event by a defined date creates something a reviewer can score. If the target changes, retain the previous target and make the revision explicit rather than silently grading the new wording.
Historical information matters here as well. The evidence available at issuance should be distinguishable from later revisions. An archive such as ALFRED illustrates the value of historical data vintages, but a provider archive does not prove what a particular user actually saw. ALFRED's documentation provides the public vintage context; the application needs its own record of use.
A forecast that is revised several times also needs a policy for evaluation. The revisions are valuable history. They should not accidentally become several independent resolved events in an aggregate score.
Compare like targets against an issuance-time baseline
A baseline makes the evaluation harder to flatter. It can be a prespecified prior, a simple model, or another comparison chosen for the task. It should be available under the same information constraints as the candidate being evaluated.
The baseline and candidate need the same target, horizon, outcome definition, and scoring convention. Otherwise, a difference in scores can reflect different questions rather than different predictive quality.
A base rate calculated after observing the evaluation outcomes can be a useful diagnostic. It is not an honest deployable baseline if that information was unavailable at issuance. A research product should retain the baseline value when the forecast is issued, with enough context to explain how it was obtained.
The same discipline applies to human judgments and model forecasts. Matching their targets is often more important than producing another summary of how confident each one sounded.
Compute a proper score in a transparent example
For a binary event, one common convention for Brier loss is the mean of the squared differences between forecast probability and outcome:
Brier loss = (1 / n) * sum((p_i - y_i)^2)Here y_i is either zero or one, and lower loss is better under this convention. Proper scoring rules reward truthful probabilistic assessment in expectation; a finite sample still contains chance variation. Gneiting and Raftery's paper develops the underlying scoring framework.
Consider 50 constructed events in five groups of ten. The data describe no product, experiment, financial strategy, or investment performance.
Synthetic events and issued probabilities
Scroll to see all columns →
| Group | Positive outcomes | Forecast A | Forecast B |
|---|---|---|---|
| 1 | 1 of 10 | 0.10 | 0.01 |
| 2 | 4 of 10 | 0.30 | 0.15 |
| 3 | 4 of 10 | 0.50 | 0.50 |
| 4 | 8 of 10 | 0.70 | 0.85 |
| 5 | 8 of 10 | 0.90 | 0.99 |
Use a fictional prespecified prior of 0.50 for every event as the baseline. It is part of the example's design, not a probability fitted after observing these outcomes.
For A's first group, the total squared error is 1*(0.10-1)^2 + 9*(0.10-0)^2 = 0.90. Summing across all five groups and dividing by 50 gives 0.18600. The corresponding loss for B is 0.20184, and the baseline loss is 0.25000.
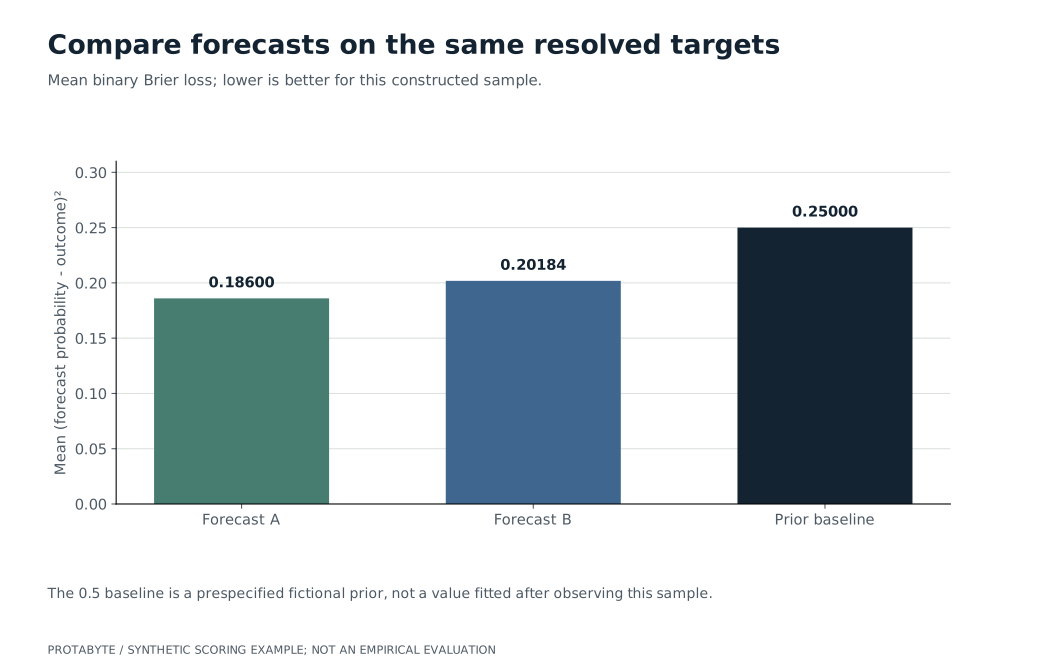
The convention belongs in the report. A score that sums squared errors over both binary categories differs by a constant factor from the single-event loss used here. Comparisons need the same definition.
Inspect calibration separately
A single Brier loss is not a pure calibration measure. It also reflects discrimination or resolution and the uncertainty of the outcomes. A lower loss can therefore coexist with worse calibration under a particular diagnostic.
The scikit-learn calibration documentation explains this distinction and describes reliability diagrams that compare predicted probabilities with observed outcome fractions. Probability calibration is a useful public reference for interpreting those plots.
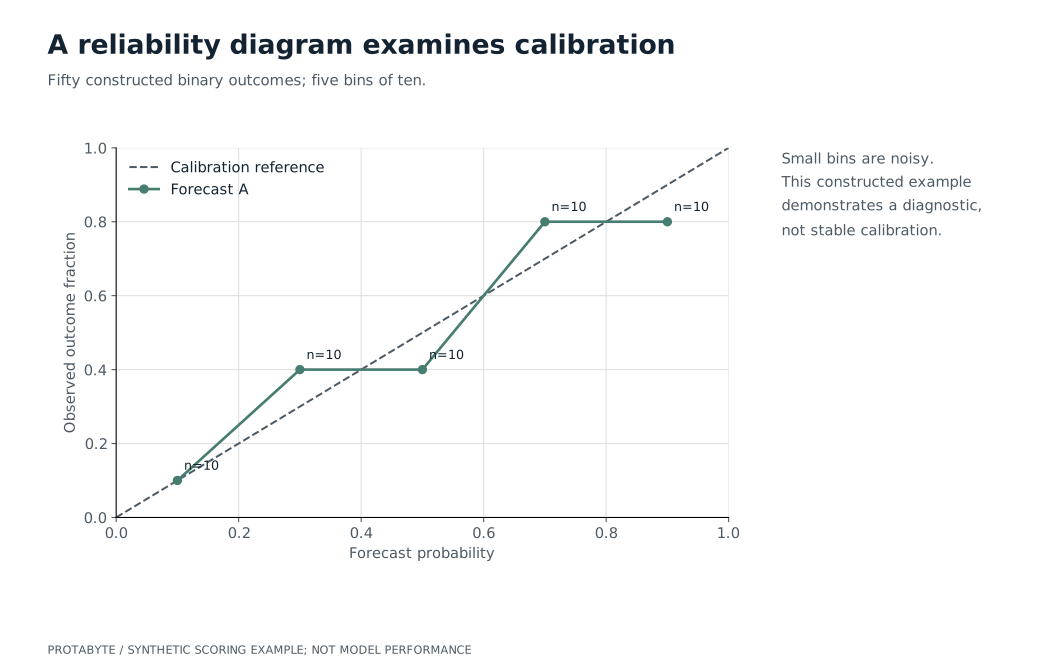
The toy baseline also illustrates the distinction. Its one combined bin predicts 0.50, and half the constructed events occur. A has a lower Brier loss while its five empirical bins show deviations from the diagonal. The example's resolution and binning choices help explain why a score and a reliability plot answer different questions.
In a real evaluation, report the counts and how bins were chosen. Sparse bins, changing task composition, and correlated events can make a smooth-looking reliability plot less informative than its appearance suggests.
Retain the cases that make the comparison inconvenient
A research system can bias its own evaluation by retaining only interesting questions, accepted recommendations, or outcomes that resolve quickly.
Rejected and deferred cases matter because they describe the selection process. Unresolved targets matter because excluding them can change the evaluated population. Missing outcomes should remain distinguishable from negative outcomes.
Dependence matters as well. Several forecasts about one event, related events driven by a common development, or repeated updates to the same target should not casually be counted as independent evidence of performance.
Changes in difficulty also affect interpretation. A later version may handle a broader or harder task mix than an earlier one. Comparing unqualified averages can hide that change. Preserve the target definitions and cohort rules needed to examine like-for-like performance, while also reporting the scope the product actually served.
The goal is an evaluation record another person can interrogate, including the choices that determine which observations entered the score.
Connect forecasts to decisions without collapsing them
A forecast can improve while the chosen action remains unchanged. A decision may have no useful alternative under its constraints. A favorable result can arise despite a weak process, and an unfavorable result can arise after a sound one.
Decision evaluation therefore needs more context: the actions considered, the constraints, the expected consequences, and the reason the person chose the action they did. Realized outcomes provide feedback, but they do not reconstruct all of those conditions.
If an organization wants to estimate the effect of a research feature, it needs a comparison design aligned with that question. Define eligible tasks, what access to the feature changes, the outcome being measured, and the alternative process. Randomized assignment, when appropriate and feasible, can strengthen the comparison; observational designs need their assumptions examined. Hernán and Robins's causal-inference text provides a framework for the distinction between observed association and causal effects.
This is a separate evidential commitment from reporting a forecasting score. A product can describe improved source coverage or better scored forecasts while remaining precise about whether a causal decision benefit has been established.
Build a journal that supports the next useful comparison
A first measurement milestone can be modest. Retain a defined target, issuance time, information cutoff, baseline, forecast, and resolution rule. Link the forecast to its evidence and any later revisions. Record a user's disposition when the product is actually used for a decision.
Then resolve a small, complete cohort under a declared procedure. Inspect missing cases, target changes, and disagreements before turning the aggregate into a public quality claim.
The useful outcome is a learning process that can improve with use. The team can distinguish unsupported answers, poorly calibrated expectations, weak discrimination, and decisions constrained by factors outside the research feature. Each finding points to a different next investment, which is exactly what a serious evaluation should make possible.
Protabyte works with teams evaluating research products and AI-assisted decisions. Talk with us about defining a useful comparison and the records needed to learn from it.